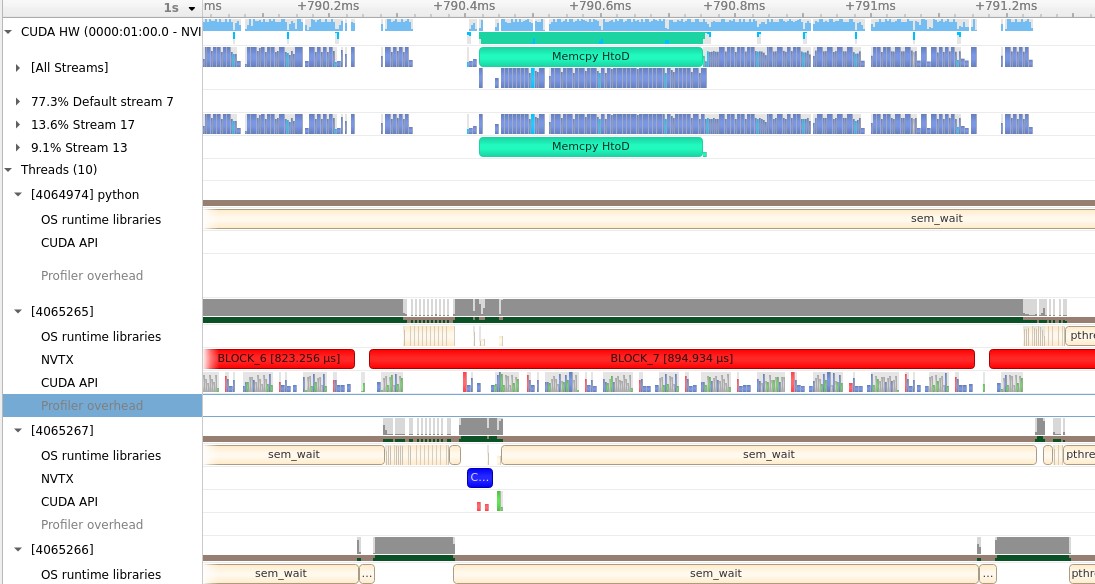
Hello ! I introduced nvtx python package when I profiled my program using Nsight System so as to get performance breakdown. However, as show below, only can I found nvtx range marker in CPU thread. I found no nvtx range marker in CUDA HW but sometimes I could (in which single thread case). Would you have some suggestions for me ?
Hello, I have the same problem. Can you help me to fingure it out?
I use nsys profile -s none -t cuda,nvtx,osrt,cudnn,cublas --capture-range=cudaProfilerApi bash myprogress to get profile file in a ubuntu GPU server.
Then I download the .qdrep file to my macbook and open it with NVIDIA Nsight systems version:2023.3.1.92
Sometimes there is no nvtx under CUDA HW.
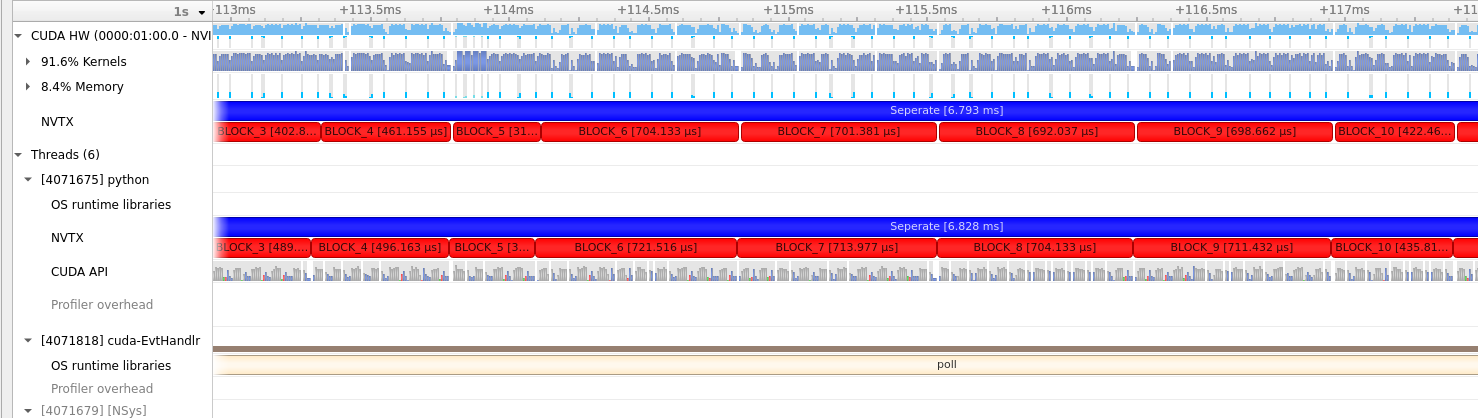
But sometions there is.
The two results are run under the same enviroment and with same code.
The only difference is that I add more nvtx.range in the first one.
I try to upgrade nsys from NVIDIA Nsight Systems version 2020.3.4.32-52657a0 to NVIDIA Nsight Systems version 2022.4.2.1-df9881f. But it does not work.
I find that clicking stream under CUDA HW and then choosing Show in Events View can get events with nvtx annotations. But this is not convenient.
How can I open the NVTX under CUDA HW.
I am looking forward to hearing from you soon.
Thanks.
I would definitely suggest updating the Nsys version.
The other odd thing I might suggest is to run the analysis without osrt option. We have/had some bugs recently with weird interactions between OSRT collections and the Mac GUI.