I modified the matrixMul sample in the CUDA samples. See code attached. Same problem exists for CUDA as well it seems.
Edit: Earlier version of this post stated that the problem wasn’t in CUDA, but I just used too few iterations and turns out they were not overlapping. After changing that, it seems the issue is indeed in CUDA.
Single-GPU
CUDA_VISIBLE_DEVICES=0 ./matrixMul
[Matrix Multiply Using CUDA] - Starting...
GPU Device 0: "Ampere" with compute capability 8.6

MatrixA(320,320), MatrixB(640,320)
Computing result using CUDA Kernel...
done
LAUNCH!
Performance= 1445.88 GFlop/s, Time= 0.091 msec, Size= 131072000 Ops, WorkgroupSize= 1024 threads/block
Checking computed result for correctness: Result = PASS

NOTE: The CUDA Samples are not meant for performance measurements. Results may vary when GPU Boost is enabled.
DONE
Runtime around 0.091 msec
Multi-threaded, multi-GPU
./matrixMul
[Matrix Multiply Using CUDA] - Starting...
GPU Device 0: "Ampere" with compute capability 8.6

MatrixA(320,320), MatrixB(640,320)
Computing result using CUDA Kernel...
done
Computing result using CUDA Kernel...
done
Computing result using CUDA Kernel...
done
Computing result using CUDA Kernel...
done
Computing result using CUDA Kernel...
done
Computing result using CUDA Kernel...
done
Computing result using CUDA Kernel...
Computing result using CUDA Kernel...
done
done
Computing result using CUDA Kernel...
Computing result using CUDA Kernel...
done
done
LAUNCH!
Performance= 413.12 GFlop/s, Time= 0.317 msec, Size= 131072000 Ops, WorkgroupSize= 1024 threads/block
Checking computed result for correctness: Result = PASS

NOTE: The CUDA Samples are not meant for performance measurements. Results may vary when GPU Boost is enabled.
Performance= 408.03 GFlop/s, Time= 0.321 msec, Size= 131072000 Ops, WorkgroupSize= 1024 threads/block
Checking computed result for correctness: Result = PASS

NOTE: The CUDA Samples are not meant for performance measurements. Results may vary when GPU Boost is enabled.
Performance= 398.93 GFlop/s, Time= 0.329 msec, Size= 131072000 Ops, WorkgroupSize= 1024 threads/block
Checking computed result for correctness: Result = PASS

NOTE: The CUDA Samples are not meant for performance measurements. Results may vary when GPU Boost is enabled.
Performance= 391.88 GFlop/s, Time= 0.334 msec, Size= 131072000 Ops, WorkgroupSize= 1024 threads/block
Checking computed result for correctness: Result = PASS

NOTE: The CUDA Samples are not meant for performance measurements. Results may vary when GPU Boost is enabled.
Performance= 393.24 GFlop/s, Time= 0.333 msec, Size= 131072000 Ops, WorkgroupSize= 1024 threads/block
Checking computed result for correctness: Result = PASS

NOTE: The CUDA Samples are not meant for performance measurements. Results may vary when GPU Boost is enabled.
Performance= 389.40 GFlop/s, Time= 0.337 msec, Size= 131072000 Ops, WorkgroupSize= 1024 threads/block
Checking computed result for correctness: Performance= 392.55 GFlop/s, Time= 0.334 msec, Size= 131072000 Ops, WorkgroupSize= 1024 threads/block
Checking computed result for correctness: Result = PASS

NOTE: The CUDA Samples are not meant for performance measurements. Results may vary when GPU Boost is enabled.
Result = PASS
Performance= 390.90 GFlop/s, Time= 0.335 msec, Size= 131072000 Ops, WorkgroupSize= 1024 threads/block
Checking computed result for correctness:
NOTE: The CUDA Samples are not meant for performance measurements. Results may vary when GPU Boost is enabled.
Result = PASS

NOTE: The CUDA Samples are not meant for performance measurements. Results may vary when GPU Boost is enabled.
Performance= 388.16 GFlop/s, Time= 0.338 msec, Size= 131072000 Ops, WorkgroupSize= 1024 threads/block
Checking computed result for correctness: Result = PASS

NOTE: The CUDA Samples are not meant for performance measurements. Results may vary when GPU Boost is enabled.
Performance= 386.39 GFlop/s, Time= 0.339 msec, Size= 131072000 Ops, WorkgroupSize= 1024 threads/block
Checking computed result for correctness: Result = PASS

NOTE: The CUDA Samples are not meant for performance measurements. Results may vary when GPU Boost is enabled.
DONE
Runtime around 0.33 msec (4x slower)
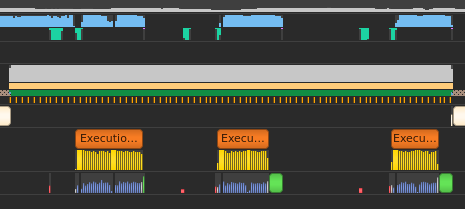
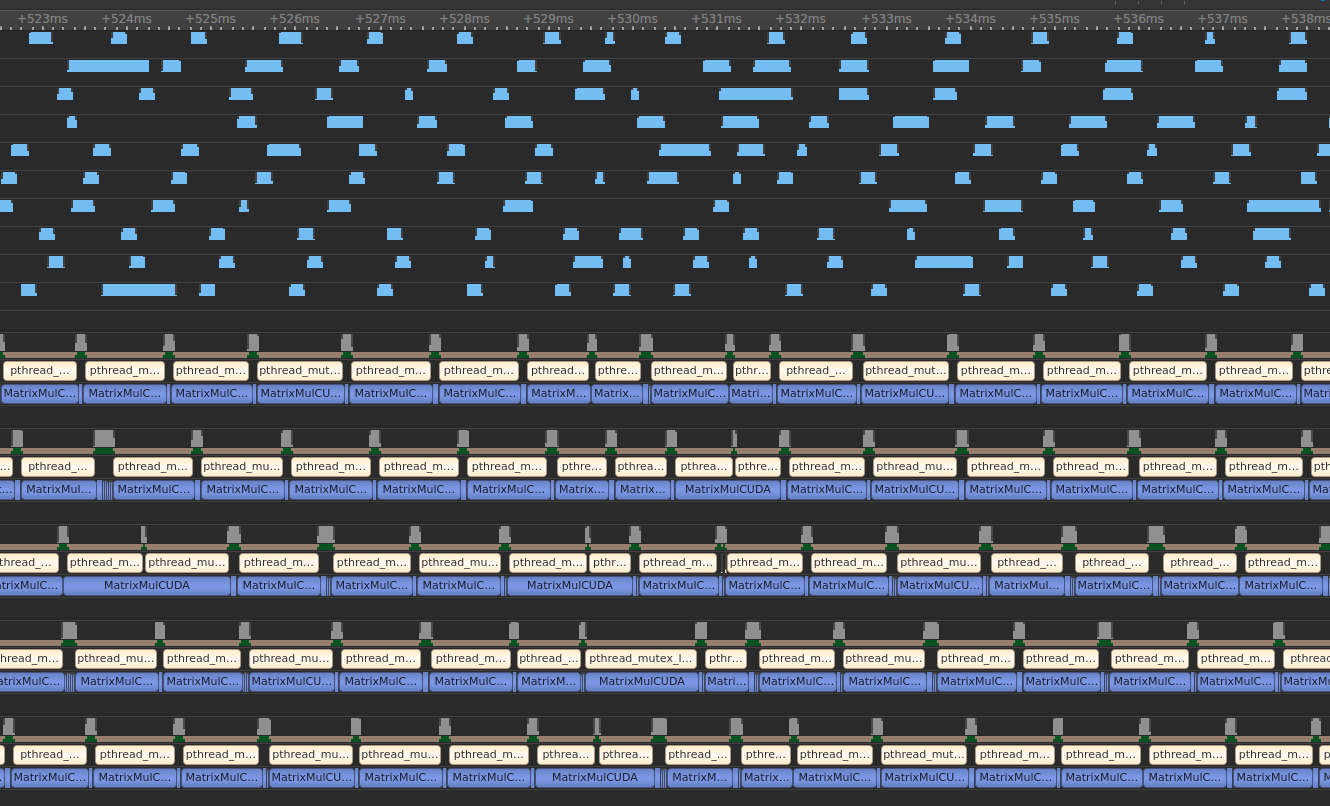
This is what the trace looks like:
Multi-process, multi-GPU
CUDA_VISIBLE_DEVICES=0 CUDA_MODULE_LOADING=LAZY ./matrixMul & \
CUDA_VISIBLE_DEVICES=1 CUDA_MODULE_LOADING=LAZY ./matrixMul & \
CUDA_VISIBLE_DEVICES=2 CUDA_MODULE_LOADING=LAZY ./matrixMul & \
CUDA_VISIBLE_DEVICES=3 CUDA_MODULE_LOADING=LAZY ./matrixMul & \
CUDA_VISIBLE_DEVICES=4 CUDA_MODULE_LOADING=LAZY ./matrixMul & \
CUDA_VISIBLE_DEVICES=5 CUDA_MODULE_LOADING=LAZY ./matrixMul & \
CUDA_VISIBLE_DEVICES=6 CUDA_MODULE_LOADING=LAZY ./matrixMul & \
CUDA_VISIBLE_DEVICES=7 CUDA_MODULE_LOADING=LAZY ./matrixMul & \
CUDA_VISIBLE_DEVICES=8 CUDA_MODULE_LOADING=LAZY ./matrixMul & \
CUDA_VISIBLE_DEVICES=9 CUDA_MODULE_LOADING=LAZY ./matrixMul
[Matrix Multiply Using CUDA] - Starting...
[Matrix Multiply Using CUDA] - Starting...
[Matrix Multiply Using CUDA] - Starting...
[Matrix Multiply Using CUDA] - Starting...
[Matrix Multiply Using CUDA] - Starting...
[Matrix Multiply Using CUDA] - Starting...
[Matrix Multiply Using CUDA] - Starting...
[Matrix Multiply Using CUDA] - Starting...
[Matrix Multiply Using CUDA] - Starting...
[Matrix Multiply Using CUDA] - Starting...
GPU Device 0: "Ampere" with compute capability 8.6

MatrixA(320,320), MatrixB(640,320)
GPU Device 0: "Ampere" with compute capability 8.6

MatrixA(320,320), MatrixB(640,320)
GPU Device 0: "Ampere" with compute capability 8.6

MatrixA(320,320), MatrixB(640,320)
GPU Device 0: "Ampere" with compute capability 8.6

MatrixA(320,320), MatrixB(640,320)
GPU Device 0: "Ampere" with compute capability 8.6

MatrixA(320,320), MatrixB(640,320)
GPU Device 0: "Ampere" with compute capability 8.6

MatrixA(320,320), MatrixB(640,320)
GPU Device 0: "Ampere" with compute capability 8.6

MatrixA(320,320), MatrixB(640,320)
GPU Device 0: "Ampere" with compute capability 8.6

MatrixA(320,320), MatrixB(640,320)
GPU Device 0: "Ampere" with compute capability 8.6

MatrixA(320,320), MatrixB(640,320)
GPU Device 0: "Ampere" with compute capability 8.6

MatrixA(320,320), MatrixB(640,320)
Computing result using CUDA Kernel...
done
Computing result using CUDA Kernel...
done
Computing result using CUDA Kernel...
done
Computing result using CUDA Kernel...
done
Computing result using CUDA Kernel...
done
Computing result using CUDA Kernel...
done
Computing result using CUDA Kernel...
done
Computing result using CUDA Kernel...
Computing result using CUDA Kernel...
done
done
Computing result using CUDA Kernel...
done
LAUNCH!
LAUNCH!
LAUNCH!
LAUNCH!
LAUNCH!
LAUNCH!
LAUNCH!
LAUNCH!
LAUNCH!
LAUNCH!
Performance= 1447.73 GFlop/s, Time= 0.091 msec, Size= 131072000 Ops, WorkgroupSize= 1024 threads/block
Checking computed result for correctness: Result = PASS

NOTE: The CUDA Samples are not meant for performance measurements. Results may vary when GPU Boost is enabled.
DONE
Performance= 1432.36 GFlop/s, Time= 0.092 msec, Size= 131072000 Ops, WorkgroupSize= 1024 threads/block
Checking computed result for correctness: Result = PASS

NOTE: The CUDA Samples are not meant for performance measurements. Results may vary when GPU Boost is enabled.
DONE
Performance= 1450.05 GFlop/s, Time= 0.090 msec, Size= 131072000 Ops, WorkgroupSize= 1024 threads/block
Checking computed result for correctness: Result = PASS

NOTE: The CUDA Samples are not meant for performance measurements. Results may vary when GPU Boost is enabled.
DONE
Performance= 1469.87 GFlop/s, Time= 0.089 msec, Size= 131072000 Ops, WorkgroupSize= 1024 threads/block
Checking computed result for correctness: Result = PASS

NOTE: The CUDA Samples are not meant for performance measurements. Results may vary when GPU Boost is enabled.
DONE
Performance= 1456.77 GFlop/s, Time= 0.090 msec, Size= 131072000 Ops, WorkgroupSize= 1024 threads/block
Checking computed result for correctness: Result = PASS

NOTE: The CUDA Samples are not meant for performance measurements. Results may vary when GPU Boost is enabled.
DONE
Performance= 1462.62 GFlop/s, Time= 0.090 msec, Size= 131072000 Ops, WorkgroupSize= 1024 threads/block
Checking computed result for correctness: Result = PASS

NOTE: The CUDA Samples are not meant for performance measurements. Results may vary when GPU Boost is enabled.
DONE
Performance= 1426.73 GFlop/s, Time= 0.092 msec, Size= 131072000 Ops, WorkgroupSize= 1024 threads/block
Checking computed result for correctness: Result = PASS

NOTE: The CUDA Samples are not meant for performance measurements. Results may vary when GPU Boost is enabled.
DONE
Performance= 1436.94 GFlop/s, Time= 0.091 msec, Size= 131072000 Ops, WorkgroupSize= 1024 threads/block
Performance= 1427.04 GFlop/s, Time= 0.092 msec, Size= 131072000 Ops, WorkgroupSize= 1024 threads/block
Checking computed result for correctness: Result = PASS
Checking computed result for correctness: Result = PASS

NOTE: The CUDA Samples are not meant for performance measurements. Results may vary when GPU Boost is enabled.

NOTE: The CUDA Samples are not meant for performance measurements. Results may vary when GPU Boost is enabled.
DONE
DONE
Performance= 1443.78 GFlop/s, Time= 0.091 msec, Size= 131072000 Ops, WorkgroupSize= 1024 threads/block
Checking computed result for correctness: Result = PASS

NOTE: The CUDA Samples are not meant for performance measurements. Results may vary when GPU Boost is enabled.
DONE
Runtime around 0.09 msec (same as sequential, so fastest possible)
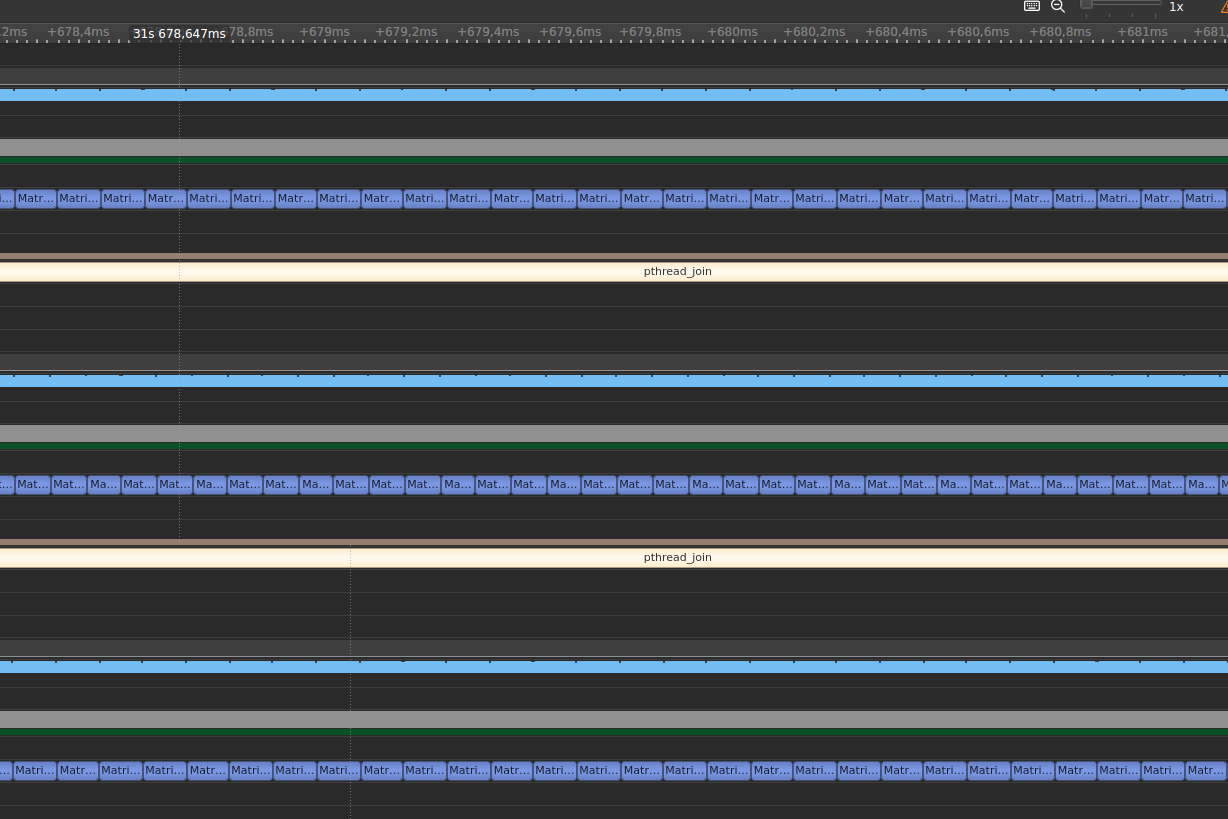
The trace:
Resources