Hi,
We use jetpack4.6 filesystem,Xavier PCIE_C4 connect a marvell 2lane gen3.0 pcie 10G switch, It seems to be working fine, but when iperf3 was used to test the bandwidth, it only reached 1 Gbps and [ksoftirQD /0] load rate is close to %100.
The pcie device tree is set to:
Linux_for_Tegra/source/public/hardware/nvidia/platform/t19x/galen/kernel-dts/common/tegra194-p2888-0000-a00.dtsi
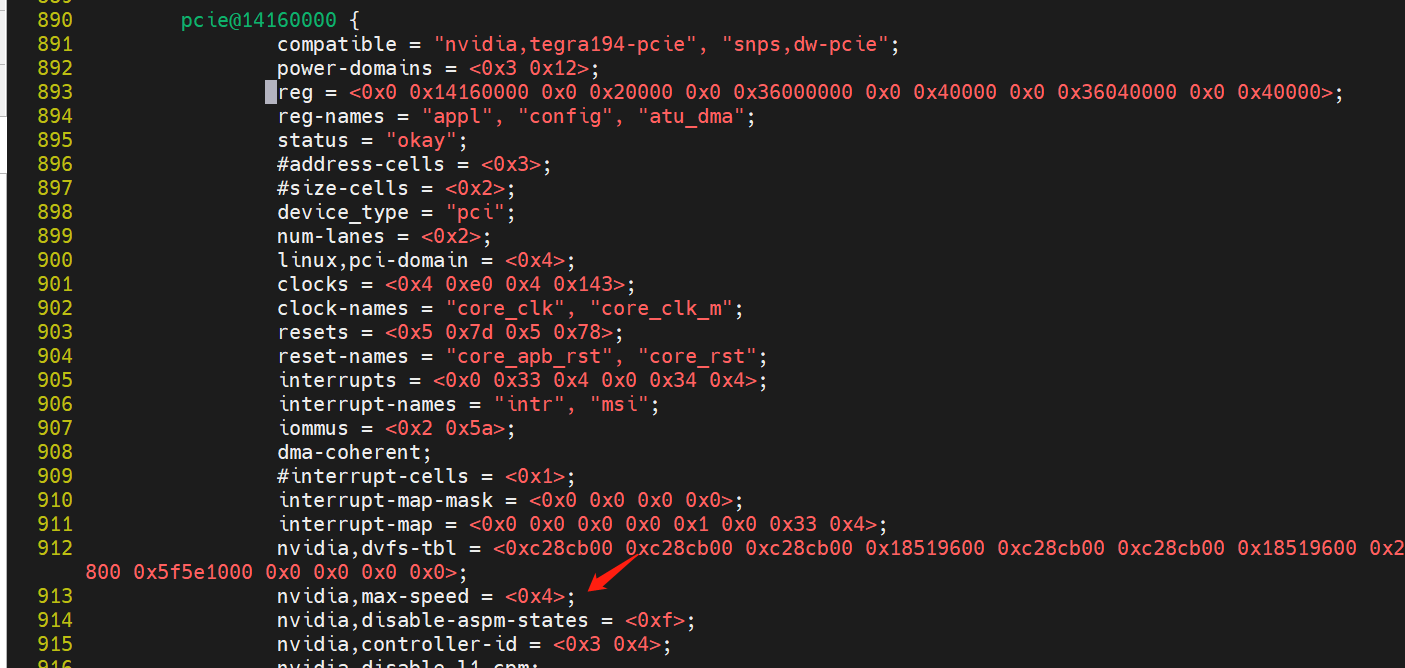
pcie@14160000 {
status = “okay”;
Yes,I perform sudo nvpmodel -m 0; sudo jetson_clocks to set the system to maximum performance;
It can slightly increase the speed measurement bandwidth, ksoftirQD /0 Occupancy is still high
I am curious, before you test, and then again after testing for a short time, what do you see from this?
egrep '(CPU|qos|ether|^IPI)' /proc/interrupts
# Note the following shows "ksoftirqd/number", where "number" is 0-based core (1 ksoft per core):
ps -eo pid,tid,pri,class,pcpu,cmd | egrep '(ksoft|COMMAND|UID|PID|CMD)' | egrep -v grep
One of the weaknesses of Jetsons is that many hardware IRQs must be on CPU0, which could cause IRQ starvation. The “/proc/interrupts” file is strictly about hardware IRQ. I wouldn’t think ksoftirqd would have this issue since it can run on any CPU, but those IRQs of course must be handed off from the hardware IRQ. If the hardware IRQ is running too fast, then ksoftirqd would actually be starved (not what you described, but it would be interesting to see if the hardware IRQ producing the software IRQ is saturated, or if instead a non-saturated hardware IRQ produces a saturated software IRQ).
Some observations regarding the IRQ info and work load…
I saw only TX and general IRQ for hardware, I did not see any RX interrupt in hardware. It would be useful to see logs after the test had been going for some time, but note that only CPU0 is used for hardware IRQ. Software IRQ (which is ksoftirqd) could in theory migrate, but it is all on CPU0. Typically the scheduler, if naive, will try to keep the software IRQ on the same core as a means of avoiding cache misses, but if the software IRQ adds too much of a load to the CPU0, and starts starving hardware IRQ servicing, then it is probably better off migrating to a new core and living with the cache miss. I’m not certain with this hardware the best way to test migrating ksoftirq/0 to another core (e.g., ksoftirqd/7), but it would be an interesting test.
I do wonder though why the ksoftirq/0 is so high. Network servicing is normally a significant part of workload, and it might just be the fact that iperf is purposely trying to load the system down as a test, but I’d think it would perform better even under those circumstances. I’d really like to see what happens if “ksoftirqd/0” becomes “ksoftirqd/7”.
The link status is under expectation, would you mind to share your iperf3 command line?
What’s the size of MTU are u test with, could you test with 64K and share here?
For bandwitdth test UDP is recommended and the bottleneck would be from the ethernet stack.
You can try with MTU size = 64K with UDP to see the improvement, but totally PCIEgen3 with 2lane would be upto 16G theoretically. U can also monitor the IRQ traffic with MTU 64K to see difference.
So I think the udp test bandwidth goes up because it doesn’t cause the load of [ksoftirqd/0] to increase.Or is there a way to solve the Ethernet Stack bottleneck for tcp?
It’s decided by the ethernet protocal and the stack, it’s not something that samilar with PCIE for bare data transation.
As you can get 8G+ performance, it’s close to the peak, if you are still want to improve on the perf, I would suggest to consult with vendor on jumbo frame support.
The perf is aimed to prove the capability which may not always can be reproduced on this performance in your real case.