win11 latest. CPU: u9-275hx GPU: RTX-5070ti laptop
lastest visual studio version(Version 17.14.6)
nvcc -V
nvcc: NVIDIA (R) Cuda compiler driver
Copyright (c) 2005-2025 NVIDIA Corporation
Built on Tue_May_27_02:24:01_Pacific_Daylight_Time_2025
Cuda compilation tools, release 12.9, V12.9.86
Build cuda_12.9.r12.9/compiler.36037853_0
nvidia-smi
Fri Jun 20 20:03:38 2025
±----------------------------------------------------------------------------------------+
| NVIDIA-SMI 576.80 Driver Version: 576.80 CUDA Version: 12.9 |
|-----------------------------------------±-----------------------±---------------------+
| GPU Name Driver-Model | Bus-Id Disp.A | Volatile Uncorr. ECC |
| Fan Temp Perf Pwr:Usage/Cap | Memory-Usage | GPU-Util Compute M. |
| | | MIG M. |
|=========================================+========================+======================|
| 0 NVIDIA GeForce RTX 5070 … WDDM | 00000000:01:00.0 On | N/A |
| N/A 48C P5 13W / 140W | 1174MiB / 12227MiB | 1% Default |
| | | N/A |
±----------------------------------------±-----------------------±---------------------+
±----------------------------------------------------------------------------------------+
| Processes: |
| GPU GI CI PID Type Process name GPU Memory |
| ID ID Usage |
|=========================================================================================|
| 0 N/A N/A 7348 C+G …yb3d8bbwe\WindowsTerminal.exe N/A |
| 0 N/A N/A 12856 C+G C:\Windows\explorer.exe N/A |
| 0 N/A N/A 13928 C+G …_cw5n1h2txyewy\SearchHost.exe N/A |
| 0 N/A N/A 14360 C+G …y\StartMenuExperienceHost.exe N/A |
| 0 N/A N/A 19708 C+G …5n1h2txyewy\TextInputHost.exe N/A |
| 0 N/A N/A 22788 C+G …crosoft\OneDrive\OneDrive.exe N/A |
| 0 N/A N/A 23048 C+G …munity\Common7\IDE\devenv.exe N/A |
| 0 N/A N/A 24312 C+G …0.3296.93\msedgewebview2.exe N/A |
| 0 N/A N/A 27344 C+G …0.3296.93\msedgewebview2.exe N/A |
| 0 N/A N/A 28708 C+G …0.3296.93\msedgewebview2.exe N/A |
| 0 N/A N/A 28756 C+G …Chrome\Application\chrome.exe N/A |
±----------------------------------------------------------------------------------------+
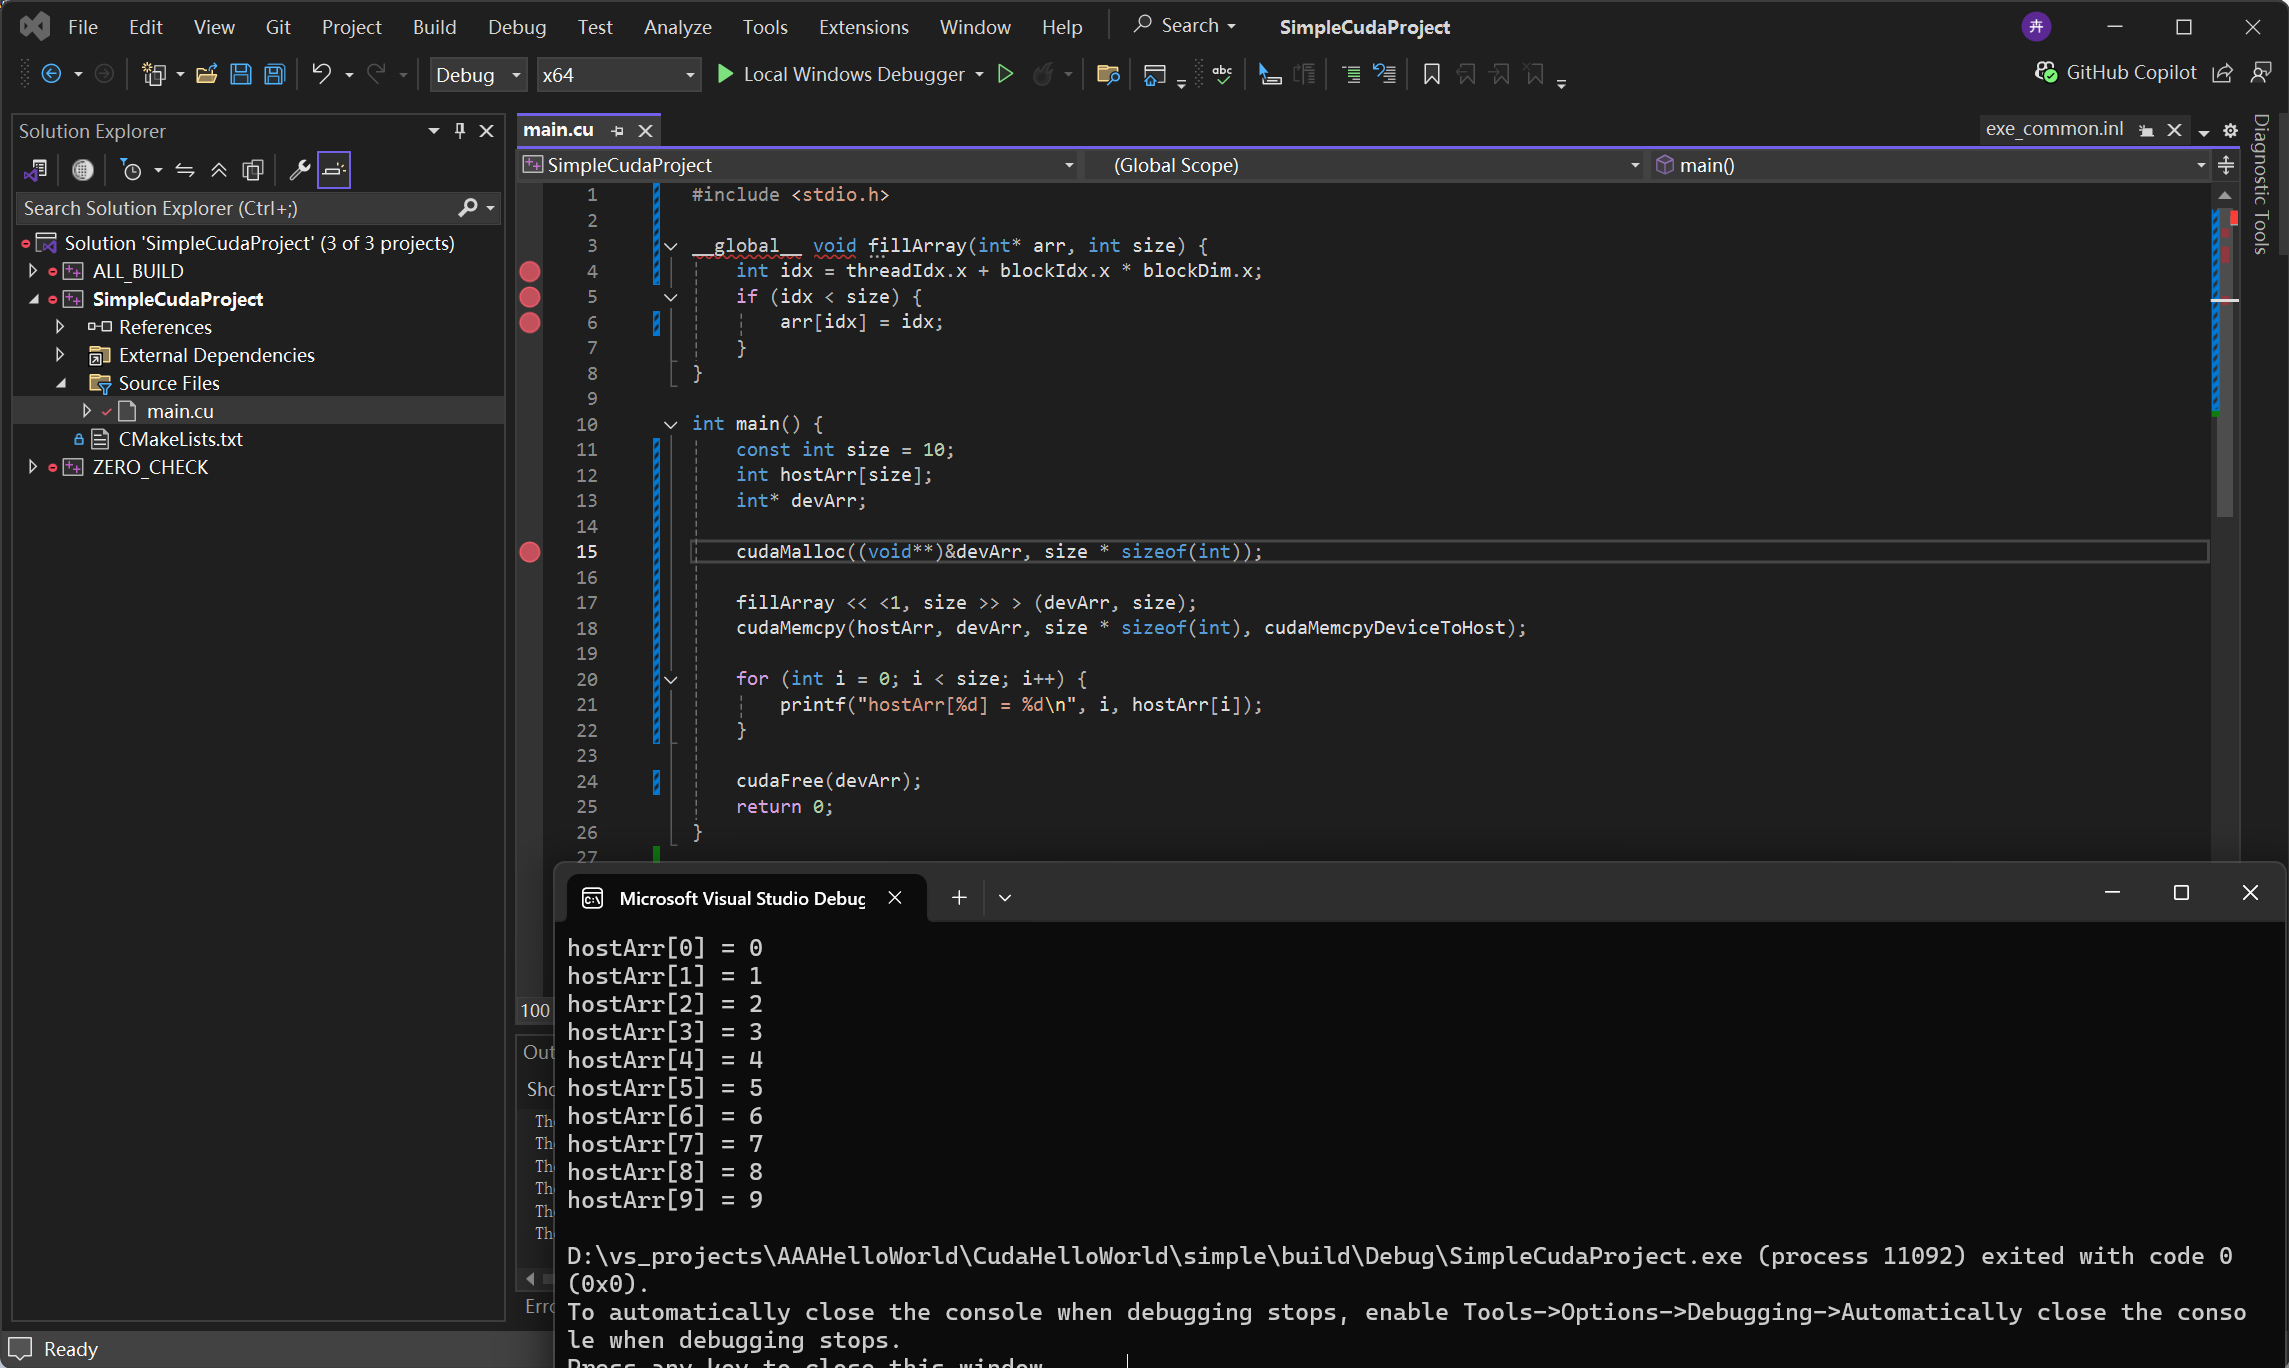
If i just run or debug with local windows debugger, everything works fine.
Just 2 weeks ago, i debug with CUDA Debugging(Next-Gen) also works fine.
But today, I try to debug with CUDA Debugging(Next-Gen) just as the weeks before, terrible and strange things happen!
Process:
1、Write a very simple cuda program. Set debug mode with -g -G.
#include <stdio.h>

__global__ void fillArray(int* arr, int size) {
    int idx = threadIdx.x + blockIdx.x * blockDim.x;
    if (idx < size) {
        arr[idx] = idx;
    }
}

int main() {
    const int size = 10;
    int hostArr[size];
    int* devArr;

    cudaMalloc((void**)&devArr, size * sizeof(int));

    fillArray << <1, size >> > (devArr, size);
    cudaMemcpy(hostArr, devArr, size * sizeof(int), cudaMemcpyDeviceToHost);

    for (int i = 0; i < size; i++) {
        printf("hostArr[%d] = %d\n", i, hostArr[i]);
    }

    cudaFree(devArr);
    return 0;
}
2、Build
3、Add some breakpoints

4、Extensions->Nsight->Start CUDA Debugging(Next-Gen)
5、Successfully get into break point in the first line of main function
6、I find that when debugging, i can’t put the breakpoint in global function, and it prompts me that the breakpoint does not exist.

6、Everytime stepping next to cuda function(sometimes cudamalloc, sometimes cudamemcpy), the computer get stuck with no response, sometimes the whole screen gets black, and i have to force to restart my computer.
7、Sometimes the computer will recover after a crash (I still can’t enter the breakpoint, and it prompts me that the breakpoint does not exist), and I saw the following error message.

What is the problem?
I could give any information, can anyone help me?
