I profiled a simple inference program like y = model(img) in pytorch in conda environment using nsys but I get the following FATAL ERROR and could you give me some suggestions?
Version:
linux ubuntu 20.04
cuda 11.3 (in conda environment)
nvcc 11.8 (in conda environment)
nvidia driver 520.56.06
nsight system 2022.3.4.34-133b775
gpu: GeForce RTX 4090
pytorch 1.8 (compiled from source)
hello,have you sovled the problem,i have the same issue as you,my platform is orin.if not tracing cuda ,nsys work normally.
Could you please share the command line you used to run nsys?
Hello,
i have basically the same error message. I’m compiling a fortran code and then running
“$ nsys profile ./a.out”
and it gives me this error:
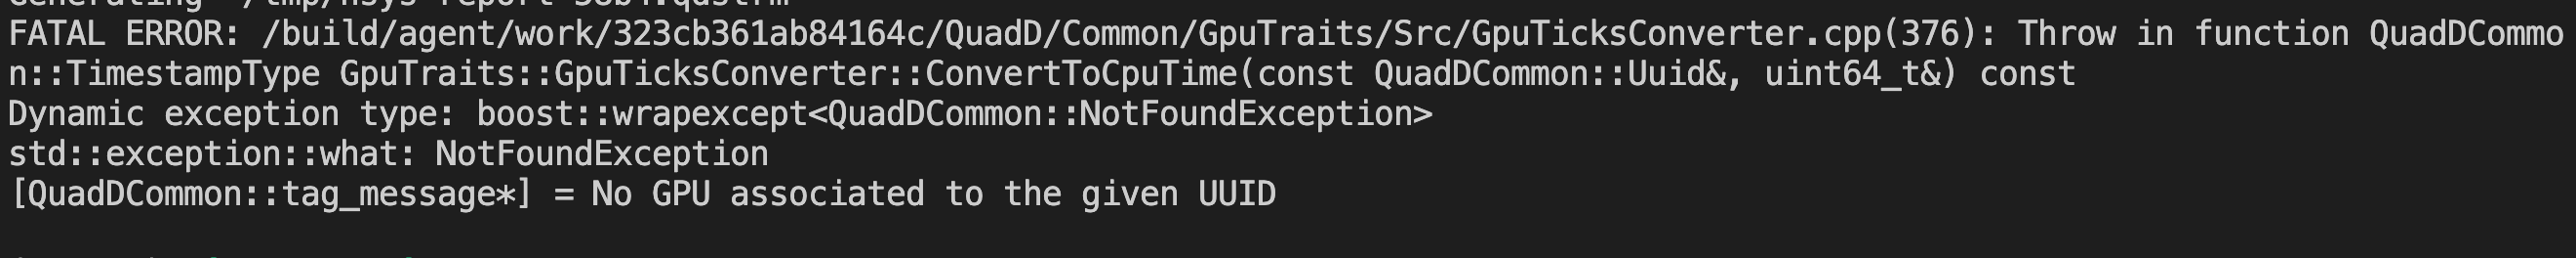
Generating ‘/tmp/nsys-report-3113.qdstrm’
FATAL ERROR: /dvs/p4/build/sw/devtools/Agora/Rel/QuadD_Main/QuadD/Common/GpuTraits/Src/GpuTicksConverter.cpp(376): Throw in function QuadDCommon::TimestampType GpuTraits::GpuTicksConverter::ConvertToCpuTime(const QuadDCommon::Uuid&, uint64_t&) const
Dynamic exception type: boost::wrapexceptQuadDCommon::NotFoundException
std::exception::what: NotFoundException
[QuadDCommon::tag_message*] = No GPU associated to the given UUID
@pkovalenko are you still looking at this?
@casclovaci1996 , can you try “nsys profile --trace=nvtx --sample=none ./a.out”. That will not run CUDA profiling or do any CPU sampling, so you won’t get much in the way of data, but it will help us triage what is going on.
Please try the latest website release and see if the issue is still there.
@hwilper thanks for the quick reply.
for some reason this issue resolved and i dont get a fatal error anymore, and i can’t reproduce the error anymore… Now it creates a report#.nsys-rep file, however nsight systems doesn’t show me the gpu activity.
i am trying to use openacc directives to offload a small fortran code to a an nvidia gpu. From a linux system there seems to be no problem creating the .nsys-rep file and running it on the nsight systems app on windows - it shows me gpu usage, cuda api etc.
on wsl2 however i can’t get it to profile the gpu usage.
I compile with “$ nvfortran myMod.f90 test1.f90 -acc=gpu” and my task manager shows me the gpu is being used, and as expected, the application runs faster. i run “$ nsys profile ./a.out” and it creates a report that i can open, however all the gpu stuff that is shown when i do the same from linux isn’t shown on wsl 2 (windows 10). it just shows the cpu and its threads.
@jcohen is our WSL expert.