I was trying to get the unified memory throughput while executing Gemm-ops based on PyTorch.
Following the manual, I executing following instruction:
ncu --query-metrics-collection pmsampling
and then I got a list of options available on Orin.
I chosn some related to the unified memory by key words ‘soc’:
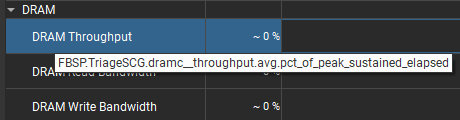
mcc__dram_throughput_op_read                                                Throughput      %               soc_mcc             MCC read throughput
mcc__dram_throughput_op_read_internal_activity                              Throughput      %               soc_mcc             MCC read throughput, internal activity
mcc__dram_throughput_op_write                                               Throughput      %               soc_mcc             MCC write throughput
mcc__dram_throughput_op_write_internal_activity                             Throughput      %               soc_mcc             MCC write throughput, internal activity
mcc__dram_throughput_srcnode_cpu_op_read                                    Throughput      %               soc_mcc             MCC read throughput from CPU
mcc__dram_throughput_srcnode_cpu_op_read_internal_activity                  Throughput      %               soc_mcc             MCC read throughput from CPU, internal activity
mcc__dram_throughput_srcnode_cpu_op_write                                   Throughput      %               soc_mcc             MCC write throughput from CPU
mcc__dram_throughput_srcnode_cpu_op_write_internal_activity                 Throughput      %               soc_mcc             MCC write throughput from CPU, internal activity
mcc__dram_throughput_srcnode_dbb_op_read                                    Throughput      %               soc_mcc             MCC read throughput from DBB
mcc__dram_throughput_srcnode_dbb_op_read_internal_activity                  Throughput      %               soc_mcc             MCC read throughput from DBB, internal activity
mcc__dram_throughput_srcnode_dbb_op_write                                   Throughput      %               soc_mcc             MCC write throughput from DBB
mcc__dram_throughput_srcnode_dbb_op_write_internal_activity                 Throughput      %               soc_mcc             MCC write throughput from DBB, internal activity
mcc__dram_throughput_srcnode_gpu_op_read                                    Throughput      %               soc_mcc             MCC read throughput from GPU
mcc__dram_throughput_srcnode_gpu_op_read_internal_activity                  Throughput      %               soc_mcc             MCC read throughput from GPU, internal activity
mcc__dram_throughput_srcnode_gpu_op_write                                   Throughput      %               soc_mcc             MCC write throughput from GPU
mcc__dram_throughput_srcnode_gpu_op_write_internal_activity                 Throughput      %               soc_mcc             MCC write throughput from GPU, internal activity
I executed some of them, just as following instructions:
sudo /usr/local/cuda-12.6/bin/ncu \
      --nvtx \
      --set full\
      --metrics pmsampling:mcc__dram_throughput_op_read.avg.pct_of_peak_sustained_elapsed \
      --force-overwrite \
      -o "$ncu_report_file" \
      $CONDA_PYTHON_PATH $script_name
as well as options:
mcc__dram_throughput_op_read_internal_activity                              Throughput      %               soc_mcc             MCC read throughput, internal activity
mcc__dram_throughput_op_write                                               Throughput      %               soc_mcc             MCC write throughput
mcc__dram_throughput_op_write_internal_activity                             Throughput      %               soc_mcc             MCC write throughput, internal activity
mcc__dram_throughput_srcnode_cpu_op_read                                    Throughput      %               soc_mcc             MCC read throughput from CPU
then I got some ‘*.ncu-rep’ files. I downloaded these files and open it with Nsight Compute GUI on windows11.
But when I tried to check, there was no metrics, just like following figure:
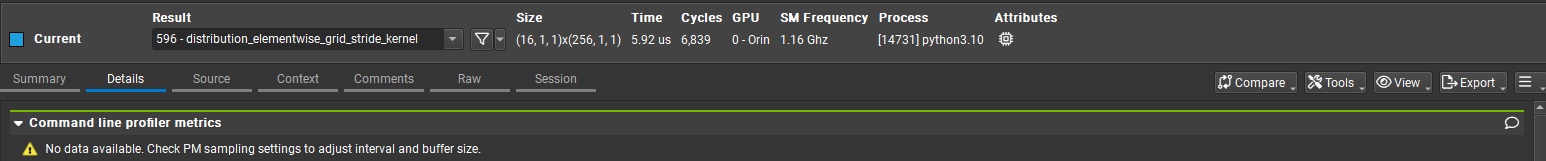
I tried to rename options, like:
pmsampling:mcc__dram_throughput_op_read
pmsampling:mcc__dram_throughput_op_read.avg
but didn’t work.
I tried other options, for example:
pmsampling:l1tex__data_pipe_lsu_wavefronts.avg
then I got the metrics:
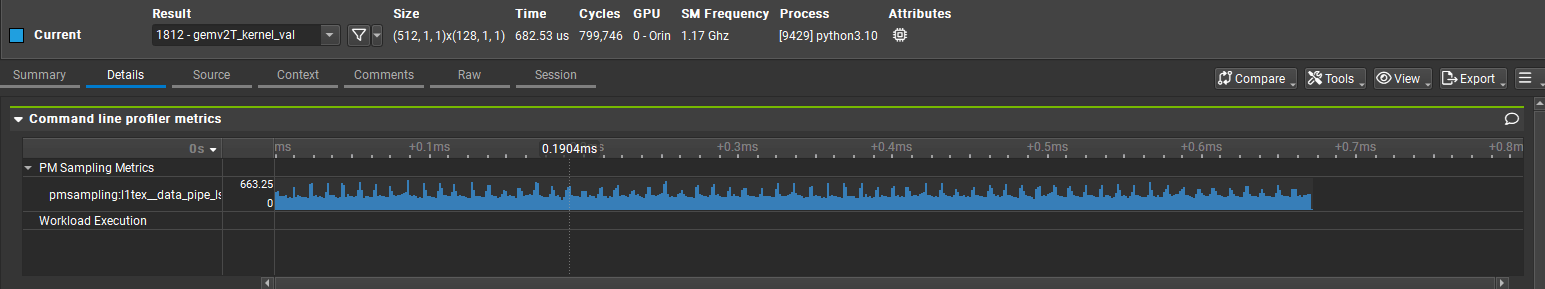
So how can I solve this problem?
Platform:
Jetson orin nx
cuda 12.6
ncu 2024.3.1.0