Hi,
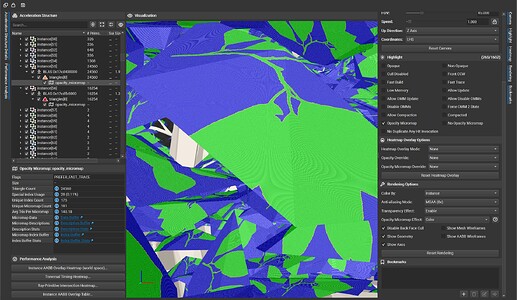
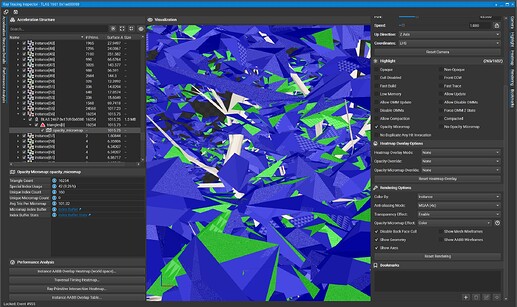
I’m trying to use Nsight Graphics to visualize my BVH with OMM, but I got two different result on Frame Debugger and Graphics Capture.

To reproduce this issue, I ran the NVIDIA OMM sample and attempted to visualize the acceleration structure:
Clearly, the Frame Debugger (first image) provides the expected visualization where I can access the bit array and descriptors, which are essential for understanding the OMM structure. On the other hand, Graphics Capture does not show these details correctly.
This inconsistency has been holding me up for a whole day because initially, I relied on Graphics Capture and obtained incorrect results.
Could anyone help explain why there is such a difference and how to resolve it?

