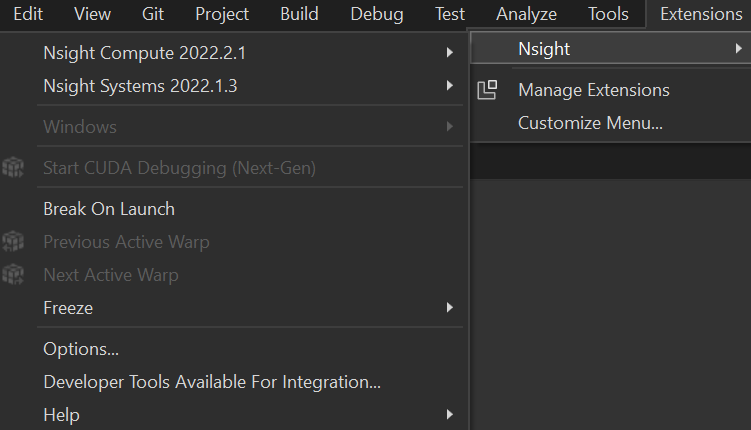
After installing the latest CUDA SDK, Visual Studio 2022 shows the NSight menu, but “Start CUDA debugging” is locked, as well as all the other NSight buttons.
Also, I can see that unlike Visual Studio 2019, my instance of Visual Studio 2022 does not automatically start Nsight Monitor, although the default settings are correct (Auto Launch Monitor on localhost = True).
I have a CMake project in Visual Studio and both the CMake configuration, building/rebuilding the project and running it works just fine (i.e. CUDA works).
Versions
Microsoft Windows 11 Pro, 10.0.22000 Build 22000
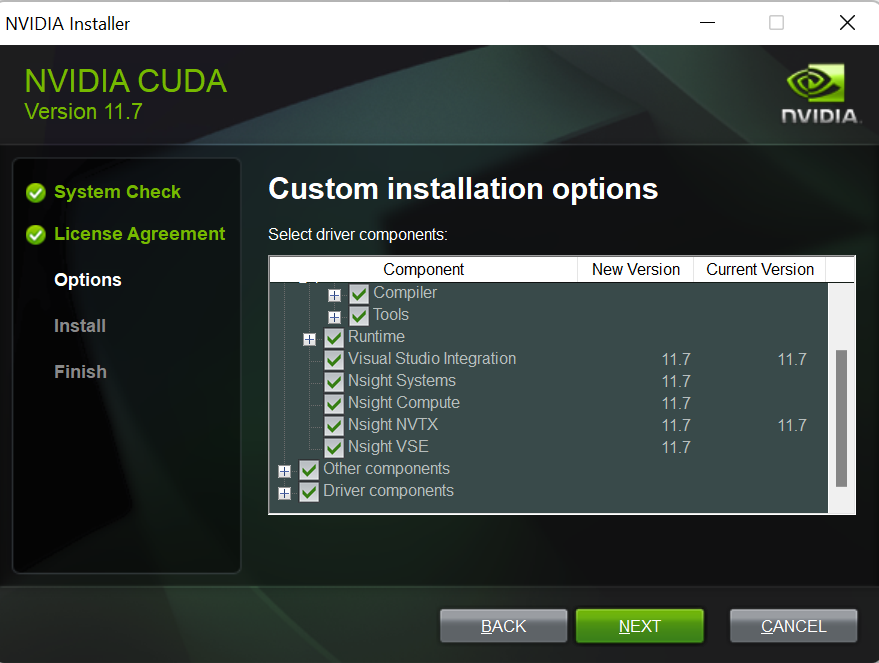
NVIDIA CUDA 11.7
NVIDIA Nsight Visual Studio Edition 2022.2.1.22136
NVIDIA Nsight Monitor 2022.2.1.22136
Microsoft Visual Studio Community 2022 (64-bit) - Preview Version 17.4.0 Preview 1.0 OR Microsoft Visual Studio Microsoft Visual Studio Community 2022 (64-bit) Version 17.3.0
I tried the following actions and it did not help to solve the problem:
Running Visual Studio and/or Nsight Monitor as administrator
Changing IDE ports for Visual Studio and Nsight Monitor
Checking that no other application is listening to port 8000 which is supposed to be used by Nsight Monitor
Completely uninstalling Visual Studio (including running devenv /resetsettings and deleting all related directories and temp files), completely uninstalling CUDA SDK and then reinstalling again from scratch. Does not work both for Visual Studio 2022 Community and Visual Studio 2022 Community Preview. I keep only 1 version of Visual Studio at a time.
Making sure that Nsight Monitor is allowed by Windows Firewall
Trying to generate logs as per the documentation (change Error to Trace). Windows does not allow to save the edited Nvda.Diagnostics.nlog: “You don’t have permission to save in this location. Contact the administrator to obtain permission”. I fixed it by editing Nvda.Diagnostics.nlog with vi under WSL, after that the logs were generated for Nsight Monitor, but there were no logs generated under Vsip\1.0\Logs even after creating the missing Logs directory and creating a Common\Configurations\Nvda.Diagnostics.nlog file both for Host and Host64 directories.
After the fresh installation I have encountered:
nvcc fatal: Cannot find compiler ‘cl.exe’ in PATH. FIXED by adding the correct path to cl.exe to Windows environment variables (Control panel > System > Advanced system settings > Environment variables > User variables for [user], Edit the Path variable, add the path to cl.exe to the top of the items list in the Path variable).
Failed to detect a default CUDA architecture. FIXED by running Project > Delete cache and reconfigure in Visual Studio’s Cmake commands.
2 things that we can look at here. First, you mentioned the Nsight Monitor, are you using the legacy debugger rather than the next-gen debugger? Note that the next-gen debugger does not use the Nsight Monitor. If you are using the legacy debugger, it is not supported in Visual Studio 2022 but it is still supported in Visual Studio 2019, you can use it there.
Next, since you mentioned that you are using CMake projects, there could be an issue depending on how you’re opening the project, resulting in the extension not triggering to load. Can you describe which command you are using to open the CMake project (eg, “Open Folder”)? One workaround you can try is open a .vcxproj-based project to trigger the extension to load, and the load the CMake project.
I did not know that Nsight Monitor is not needed for the next-gen debugger. I am sorry if I have missed that in the official documentation, could you please refer me to the respective section in the documentation?
I am totally fine to use the next-gen debugger, but unfortunately it does not work, as described in my original post.
Maybe I am doing something wrong with the installation? How a fresh, “from zero” installation shall be done?
Install Visual Studio 2022 and then install CUDA SDK with “Visual Studio Integration” and “Nsight VSE” included?
If those gets installed, I don’t understand why one shall install NVIDIA Nsight Integration (64-bit) extension inside Visual Studio 2022.
To be honest, I don’t understand if the “NVIDIA Nsight Visual Studio Edition 2022.2.1.22136” comes from the CUDA SDK installation or from a Visual Studio extension:
Regarding CMake, I open it with “Open Folder”. Usually it gets added to my recently used projects. If I click “Project > Delete cache and reconfigure”, I get a successful run of CMake for this very CUDA project:
1> CMake generation started for configuration: 'x64-Debug'.
...
1> [CMake] -- The CUDA compiler identification is NVIDIA 11.7.99
1> [CMake] -- Detecting CUDA compiler ABI info
1> [CMake] -- Detecting CUDA compiler ABI info - done
...
1> [CMake] -- Detecting CUDA compile features
1> [CMake] -- Detecting CUDA compile features - done
1> [CMake] -- The CXX compiler identification is MSVC 19.34.31721.0
1> [CMake] -- Detecting CXX compiler ABI info
1> [CMake] -- Detecting CXX compiler ABI info - done
...
1> [CMake] -- Detecting CXX compile features
1> [CMake] -- Detecting CXX compile features - done
1> [CMake] -- Configuring done
1> [CMake] CMake Warning (dev) in CMakeLists.txt:
1> [CMake]   Policy CMP0104 is not set: CMAKE_CUDA_ARCHITECTURES now detected for NVCC,
1> [CMake]   empty CUDA_ARCHITECTURES not allowed.  Run "cmake --help-policy CMP0104"
1> [CMake]   for policy details.  Use the cmake_policy command to set the policy and
1> [CMake]   suppress this warning.
1> [CMake]
...
...
1> Extracted CMake variables.
1> Extracted source files and headers.
1> Extracted code model.
1> Extracted toolchain configurations.
1> Extracted includes paths.
1> CMake generation finished.
I tried opening another project, but which is not CMake (C#). Next-gen CUDA debugging was shown as active!
However, when I opened the CMake project again, I get this message from CMake: [Nsight VS Integration] WRN: Assert failed: 'Failed to retrieve the active configuration'. The Next-gen CUDA debugging button is still disabled.
Also, after restarting Visual Studio, it looks like for some reason it has reset its settings, I got a prompt (again) from Nsight Visual Studio Integration to collect telemetry. Also, the Nsight button got hidden under the Extensions menu.
I have updated Microsoft Visual Studio Community 2022 (64-bit) - Preview to Version 17.4.0 Preview 2.0 which has a newer version of CMake (3.24.1), but the original bug still persists.
All CUDA debugging buttons are still greyed out (disabled).
@Elton, @jmarusarz maybe you could recommend trying some other fixes while we are waiting for the updates from the engineering team?
The command moving to under Extensions is Visual Studio behavior that I believe was introduced in Visual Studio 2019. You can move it back to the main menu by:
Right-click on the main toolbar, then click ‘Customize…’
Click the ‘Extensions Menu’ tab
Uncheck the extensions that you want on the top-level menu
For now one way to work around the disabled menu item for debugging would be to open your built .exe in Visual Studio. This is actually a supported project type in Visual Studio, and Nsight does support debugging directly from an .exe project. For more info on Visual Studio .exe projects, see How to debug and profile any EXE with Visual Studio.
When I open it as a solution in Visual Studio, as per @Elton’s recommendation, “Start CUDA Debugging (Next-Gen)” becomes enabled.
Which means that probably the original problem is due to some bug of the NSight Visual Studio Edition extension which for some reason does not work with a CMake-based project.
Nevertheless, after opening the .exe file and adding the source code, I cannot debug it as the breakpoints do not work:
An addition to the previous post (using an .exe as a workaround to enable CUDA debugging):
Some breakpoints in CUDA code are just not being hit, but there are no warnings about that. They get skipped silently.
Some other breakpoints in the same CUDA code, but in another file, get a warning “The breakpoint will not currently be hit. No executable code of the debugger’s target code type is associated with this line…”
Apparently CMake projects are not supported by NSights, at least not after trying a lot of things to enabled it. The only workaround is to generated a Visual Studio Solution from CMake and open it like a Visual Studio Project instead of Open Folder
I forget were I learned this, so sadly I can’t attribute –
Visual studio will ignore files matched by .gitignore, which I happened to have *.txt in…so CMakeLists.txt was being ignored. Once I removed it, everything started to work as intended.
There may be people experiencing other causes, but I hope someone benefits from that solution